Mystery Shopping Software vs Spreadsheets: Why Manual Audits Fall Short

Almost every mystery shopping programme starts the same way. Someone builds a questionnaire in Google Forms or Excel, shares it with a few shoppers, and pastes the answers into a master sheet. For a pilot across a handful of stores, that is perfectly reasonable.
The trouble is that pilots grow. A few stores become a region, then a country. Monthly visits become fortnightly. One agency becomes three. At some point the spreadsheet stops being a tool and becomes the job. This post looks at where manual audits fall short, and what dedicated mystery audit software changes.
Why spreadsheets feel like enough at first
Spreadsheets are familiar, free and flexible. Anyone on the team can add a column, write a formula or build a quick chart. When you only have a few visits a month, the manual effort is small and you can check every row yourself.
They also feel safe. The data is in a file you control, and you can share it with anyone. For early experiments, that flexibility is genuinely useful because you are still deciding what to measure.
The problems are not obvious on day one. They build up quietly as the programme grows.
Where manual audits start to break
Version chaos
With several people editing, you end up with “Final_v3_updated_Rahul.xlsx” and nobody is sure which file is current. Questions get reworded mid-cycle, columns shift, and scores from one month cannot be compared cleanly with the next.
No proof attached to the answer
A spreadsheet row says the staff greeted the customer within a minute. It cannot show you where the shopper was, when the visit happened or whether the photo in a separate folder belongs to that visit. Evidence and answers live in different places.
Fraud is hard to spot
Without location and time stamps on photos, it is difficult to catch a shopper who reuses old pictures, pulls images from the internet or fills in a report without visiting. Reviewers rely on gut feel.
Quality checks depend on stamina
Someone has to read every response, look at every photo and decide whether the report is acceptable. That is slow, and judgement drifts across reviewers and across a long day.
Reporting is always behind
Before a manager sees results, someone has to clean the sheet, fix formats, build pivots and paste charts into a deck. The insight arrives weeks after the visit, when the store team has already moved on.
Findings do not turn into actions
Even when the deck is good, it usually ends as a presentation. There is no simple way to assign “fix the fitting-room wait time in store 14” to a person and see whether it was done.
The hidden costs of staying manual
Manual audits look cheaper because the tools are free. The real costs show up elsewhere:
- Staff time. Cleaning, checking and reporting can take more hours than the visits themselves.
- Decisions made on weak data. If you are not sure the visits happened as reported, every conclusion carries a question mark.
- Lost momentum. When results arrive late, store teams see them as history rather than feedback.
- Shopper drop-off. Clumsy processes and slow payments make good shoppers less likely to come back.
- Limited growth. Adding stores or cities adds work in a straight line, so the programme stops growing when the team is full.
What changes with mystery audit software
Dedicated software is built around the audit rather than around a grid of cells. The difference is easiest to see stage by stage.
Here is how the two approaches compare at each stage:
- Questionnaire. Spreadsheet: a sheet or form that can be edited by anyone. Software: a locked template per cycle so every visit is measured the same way.
- Assignment. Spreadsheet: calls and messages to shoppers you know. Software: shoppers ranked by best match and reached automatically over app push, email, WhatsApp and SMS.
- Evidence. Spreadsheet: photos in folders, if they arrive. Software: geo-stamped photos with address, date and time, collected against a proof checklist.
- Checking. Spreadsheet: manual review of a sample. Software: AI-assisted checks on every report, with fraud flags for reused, edited or AI-generated images.
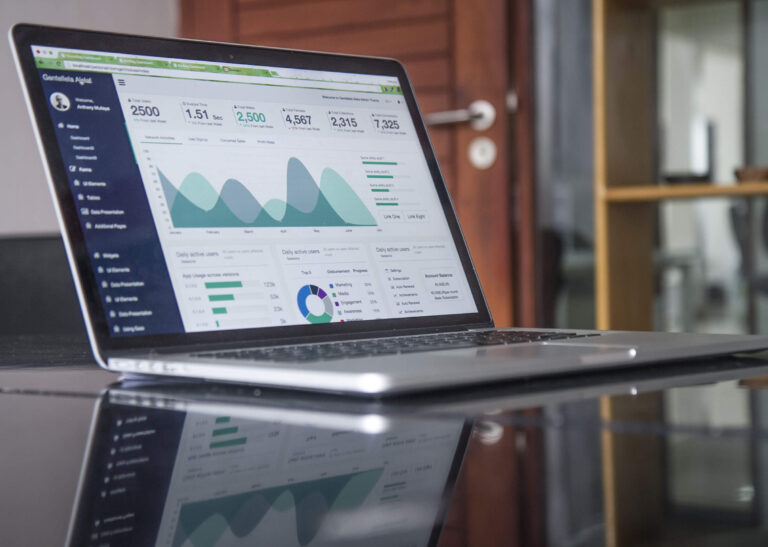
- Reporting. Spreadsheet: pivots and slides built by hand. Software: live dashboards with heatmaps, city and store views and cycle comparison.
- Action. Spreadsheet: a list in an email. Software: actions assigned to owners and tracked to closure.
When it is time to switch
You do not need software for a one-off pilot. These signs suggest you have outgrown the spreadsheet:
- You audit more stores than one person can check by hand each cycle.
- You have caught, or suspect, at least one fake or reused photo.
- Monthly reporting takes more than a few days to prepare.
- Store managers ask for their own results and you send them filtered files.
- You want to compare cycles but question wording has changed between them.
- You work with more than one field agency.
If three or more of these apply, the time spent maintaining the manual system is probably higher than the cost of a platform.
What to expect in the first cycle
The first cycle on a new platform is usually the busiest. Shoppers learn the app, store lists get cleaned up and the team gets used to new dashboards. Plan for a short learning period, keep the old reports to hand for reference, and judge the switch on the second and third cycles rather than the first.
Making the move without losing history
Switching does not mean starting over. A sensible migration looks like this:
- Freeze the current questionnaire and agree section weightage before moving it into the new template.
- Map old questions to new ones so past scores can still be compared, even if only at section level.
- Import your store master with city, region and manager details so dashboards are filtered correctly from the first cycle.
- Run one cycle in parallel if your stakeholders need reassurance, then retire the sheet.
If you are still deciding which kind of audit you need in the first place, our older post on the different types of retail audits is a useful primer, and our retail audits page explains how FloorWalk runs them.
How FloorWalk helps
FloorWalk moved its own programmes from manual processes to a dedicated platform and now runs audits across 350+ Indian cities and 22+ countries. Our mystery shopping software automates up to 95% of the audit process: best-match shopper ranking, automated outreach, geo-stamped photos with proof checklists, AI-assisted quality checks and photo fraud detection on every report. Brand teams see results in dashboards with section heatmaps, city and store performance, cycle comparison and action tracking, and can still export PDF and Excel reports when they need files.
Frequently asked questions
Can I keep using Excel for analysis after switching?
Yes. Good platforms export to Excel, so analysts can keep their own models while managers use the dashboards.
Will my old audit data be lost?
Not if you plan the move. Past results can be kept as a reference, and questions can be mapped so section scores remain comparable.
Is software worth it for a small number of stores?
For a few stores and occasional visits, a well-run spreadsheet can be enough. The case for software grows with the number of stores, cycles and people involved.
How do I convince leadership to switch?
Show the hours spent cleaning and checking data each cycle, and any cases of doubtful reports. Those two numbers usually make the case. You can also talk to our team for a walkthrough on your own questionnaire.
See your stores through your customers’ eyes
FloorWalk runs mystery shopping across 350+ Indian cities and 22+ countries on its own AI-powered audit platform.