Mystery Shopping Dashboards: What Brand Teams Should Track
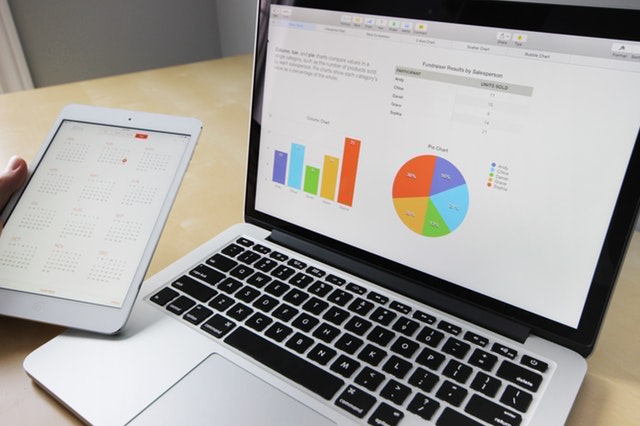
Most brands that run mystery shopping have a dashboard. Far fewer have a dashboard their teams actually use. Too often it becomes a screen someone screenshots for the monthly review, while store managers carry on without looking at it.
The difference is rarely the charting tool. It is what the dashboard is built to show, who it is built for, and how it fits into the way regional and store teams already work. This post covers the views and metrics that matter most, and how to make them part of everyday management.
Start with the questions, not the charts
Before choosing any metric, write down the questions each audience needs answered.
- Leadership wants to know: Are we improving overall? Where are the biggest risks?
- CX or service quality heads want to know: Which parts of the customer journey are weakest? Which regions need attention?
- Regional and area managers want to know: Which of my stores are slipping? What should I coach this month?
- Store managers want to know: How did my store do, what did the shopper experience, and what exactly should we fix?
A dashboard that tries to answer every question on one screen answers none of them well. Build views for each audience instead.
The core views every dashboard needs
1. Overall score and trend
A single headline score for the network, with its movement over recent cycles. This is the one number leadership will remember, so it should be calculated consistently every time.
2. Section heatmap
Break the score into the sections of your questionnaire, such as greeting, needs analysis, product knowledge, closing and store ambience, and show them as a heatmap by region or city. The weakest cells tell you where to focus training.
3. City and store performance
A ranked view of cities and stores, with the ability to filter by region, format or store age. Ranking is useful, but it should always sit next to context such as the number of visits behind each score.
4. Audit-cycle comparison
A side-by-side view of this cycle against the previous one, at network, region and store level. This is how you prove whether actions are working.
5. Store trends
For each store, a simple line of scores across cycles. A store that dropped sharply this cycle needs a different conversation from one that has been weak for a year.
6. Improvement areas
A list of the questions most often failed, across the network and for each store. This turns scores into specific behaviours to fix.
7. Action tracking
For each improvement area, an owner, a due date and a status. Without this view, the dashboard reports problems but never shows whether they were solved.
Reading a section heatmap: a worked example
Imagine a footwear brand with stores in four regions. Its heatmap has five sections across the top (greeting, needs analysis, product knowledge, trial and fitting, billing) and the four regions down the side.
At first glance, the overall scores look similar across regions. The heatmap tells a different story:
- Needs analysis is pale in every region. Staff are greeting customers and showing products, but rarely asking what the customer is looking for. That points to a network-wide training gap, not a regional one.
- Billing is weak in only one region. Drilling down shows three stores with long queues at peak hours. That is a staffing or layout issue for the regional manager, not a training topic.
- Trial and fitting is strong everywhere. That is worth recognising, so teams know what they are doing well.
The same overall score could hide all three of these patterns. The heatmap separates a company-wide fix, a local operational fix and a strength to protect, which is exactly what a CX team needs to plan the next quarter.
Choosing the right level of detail
Too little detail and managers cannot act; too much and they stop reading. A useful rule is to show three levels: the network view for leadership, region and city for CX and regional managers, and single store with linked reports for store managers. Each level should be reachable in one or two clicks from the one above.
Metrics worth tracking
Beyond scores, a few operational metrics keep the programme healthy:
- Visit completion: planned versus completed visits per cycle.
- Time to report: days between visit and the report appearing on the dashboard.
- Coverage: share of stores audited at least once in the period.
- Action closure rate: share of assigned actions completed by their due date.
- Repeat failures: questions a store fails in two or more consecutive cycles.
The last one is often the most useful. A one-off miss can be bad luck; a repeat failure usually points to a process or training gap.
Making the dashboard useful for store teams
Store managers are the people who can actually change the customer experience, so their view deserves the most care.
- Show only their store, with an easy comparison to the regional average.
- Lead with a short summary of what went well, what didn’t and what to improve, before any charts.
- Link scores to evidence, such as photos and comments, so managers understand exactly what happened.
- Keep it mobile-friendly, because many managers will check it on their phone between customers.
- Avoid public shaming. Rankings can motivate, but they should be shared thoughtfully.
Habits that make dashboards stick
A dashboard becomes useful when it is part of a routine.
- Weekly regional reviews: regional managers pick two or three stores to discuss each week.
- Monthly section reviews: the CX team looks at the heatmap and agrees on one training focus.
- Cycle reviews: after each audit cycle, leadership reviews cycle-over-cycle movement and overdue actions.
- Store huddles: store managers share the summary with their team and agree on one change to try.
If you are still building the business case for an audit programme, our older post on what mystery shopping is explains the basics, and our page on mystery shopping for brands shows how FloorWalk sets programmes up.
Common dashboard mistakes
- Too many metrics. If everything is highlighted, nothing is.
- Scores without evidence. Managers will dispute numbers they cannot connect to a real visit.
- Monthly exports instead of live data. By the time a PDF arrives, the moment has passed.
- No cycle comparison. Without it, you cannot tell whether things are improving.
- No owner for actions. Findings sit on the screen until the next cycle repeats them.
How FloorWalk helps
FloorWalk’s mystery shopping software gives brand teams a portal built around these views: dashboards with section heatmaps, city and store performance, audit-cycle comparison, improvement areas, store trends and action tracking. Each report includes an AI summary of what went well, what didn’t and what to improve, and teams can still export PDF and Excel reports when they need to share results offline. Because every report has passed AI-assisted quality checks and photo fraud detection, the numbers on the dashboard rest on verified visits.
Frequently asked questions
How often should the dashboard update?
As soon as reports are approved. Waiting for the end of a cycle delays action in stores that were visited early.
Should store managers see other stores’ scores?
Many brands show store managers their own results alongside regional averages rather than full rankings. It depends on your culture.
Can we see results by city or region?
Yes. City and store performance views are a core part of a good dashboard, with filters for region and format.
Where can I see examples of programmes in action?
Our case studies describe programmes we have run for brands across categories.
See your stores through your customers’ eyes
FloorWalk runs mystery shopping across 350+ Indian cities and 22+ countries on its own AI-powered audit platform.